CP5065-2021S1-2A07-GROUP3
WEEK 5 - PRACTICAL 2
As part of our ICPD Practical 2 we were tasked with utilizing the air lift pump mechanism in order to accomplish the task in hand which was to allow water to flow upwards a U-Tube into a water collection source.

HOW DID WE DO IT?
Since we had to conduct the practical at home, we did it through streaming our live videos by using MS Teams so that we could also save a recording of the practical while doing it.
That being said, we had to assign roles to each other so that we will know what to do during the practical and who will be responsible for what task:
Team leader: Ensure all the procedures are executed (Amelia)
Experimenter: Set up and carry out the hands-on part of the experiment (Jonathan)
Timekeeper: Record the time, tabulate data and plot graphs (Ernest)
Blogger: Consolidate and type the documentation in the blog (1 to 2 members) (Darence)

PRACTICAL PROCEDURES
To conduct this practical there will be multiple lengths to measure which includes the distance in the U-Tube of the transparent tubing connected to the air pump (Labeled "a") and the distance between the bottom of a pail containing water and the hole of the U-Tube (Labeled "b")
In experiment 1:
Length "a" will be at 2cm at its starting point and slowly increase by 2cm for each recording while capping at a maximum of 10cm which means the length of the tube inside the U-Tube will go deeper as the experiment progresses.
In experiment 2:
Just like experiment 1, experiment 2 will affect the distance "b" which it will increase from 10cm to 20cm, the tube will get higher as the experiment progresses.
Purpose:
We were tasked with finding whether the change in length of either "a" or "b" will impact the flowrate of water from the pail to another container using the air lift pump mechanism.
ISSUES THAT OCCURRED
While we were running the experiment, we noticed that the water content was too little to accurately identify any change in the flowrates since they were all so slow, to solve this, we filled the pail near the brim in order to be able to identify the different flowrates of each length.
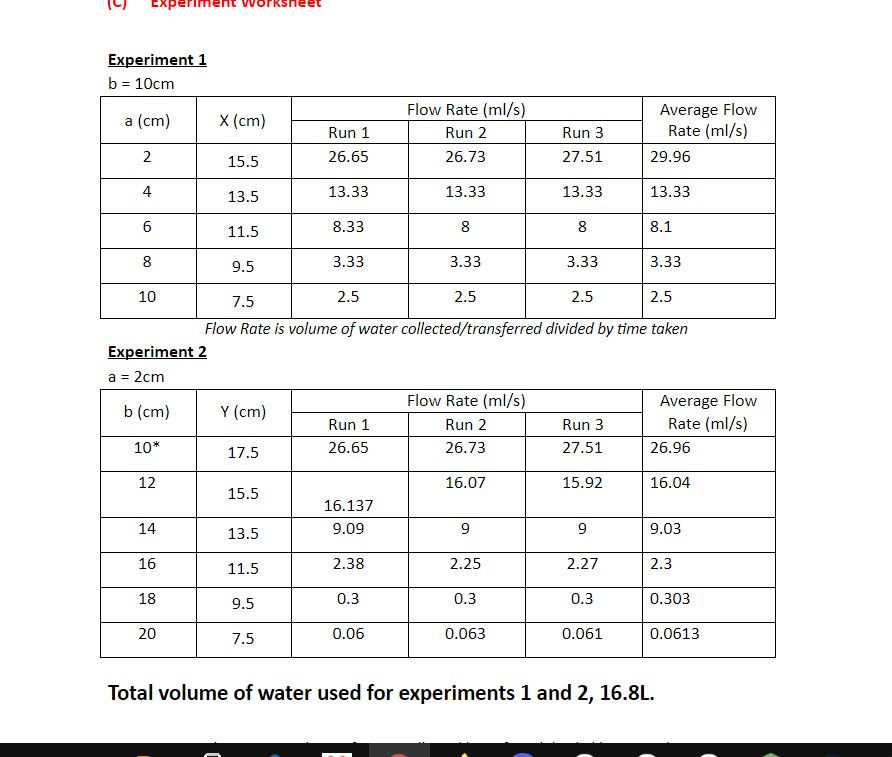
DATA COLLECTED
The pictures attached below are a compilation of data collected and graphs made with the data


QUESTIONS TASKED TO US
1. Conclusion from the first graph
Flowrate is observed to be higher when the tube is greater submerged in the liquid.
2. Conclusion from the second graph
Similarly to the first graph the same trend is observed where the flowrate is higher when the tube is grater submerged in the liquid.
3. Summarize the learning, observations and reflection in about 150 to 200 words.
This practical has taught us more about the air lift pump mechanism which is commonly used in industries as an economical way to let process fluid flow through the plant.
A higher flow rate can be observed when the PVC tube is submerged deeper into the liquid source and a lower flow rate is observed when it is higher up and a sound can be heard which mimics cavitation.
A small increase such as 2m in the distance between the pipe and the bottom of the pail can lead to a major difference in liquid flow rate. (Can be seen when the distance of B increases from 16cm to 18cm)
In conclusion, throughout this experiment we noticed that many procedures in this practical can be reflected onto an actual chemical plant and its features such as a tank having a low level alarm due to water not being able to flow thus causing cavitation to occur.
4. Explain how you measure the volume of water accurately for the determination of the flowrate?
We used a weighing scale to weigh the beaker that we used to contain the outlet water flow in grams. This would accurately measure the volume of water as 1g of water = 1mL of water as the density of water is assumed to be 1. (Since density of water is approximately 1 we assumed it to be 1)
5. How is the liquid flow rate of an air-lift pump related to the air flow rate? Explain your reasoning.
The flow rate of liquid increases as the air flow rate increases. This is because the pump produces compressed air to push the liquid up the transparent tubing, so if the amount of compressed air produced increases, the amount of liquid being pushed up the tube will increase as well.
6. Do you think pump cavitation can happen in an air-lift pump? Explain.
Cavitation will not happen in an air lift pump. This is because cavitation only happens to liquid pumps when the NPSHA is lower than that of the NPSHR and that the vapour pressure at the suction is lower than that of the liquid’s vapour pressure. This would cause air bubbles to form which is known as cavitation. For an airlift pump since it operates with air as its medium there would be no liquid pressure or NPSHA which is why air lift pumps would not cavitate.
7. What is the flow regime that is most suitable for lifting water in an air-lift pump? Explain.
The most suitable flow regime is the slug flow. Slug flow is characterized by a series of liquid slugs followed by longer air slugs flowing through a pipe, which translates to compressed air produced by the pump pushing the liquid through the tube. The reason why the slug flow regime is most suitable for an air lift pump is because the flow regime serves as a “check valve” in which it prevents any backflow of water back into the pump and is more efficient than the bubbling flow regime.
8. What is one assumption about the water level that has to be made? Explain.
One assumption is that there is no loss of water during the experiment and that the water level stayed the same throughout the experiment. This assumption is made so that we would not need to factor in from the water loss to the surrounding via evaporation as evaporation happens at any given temperature. It would be really challenging to account for the water loss to the surrounding or even between the walls of the beaker that we have used to collect our water.
VIDEO AND PHOTOS OF OUR PRACTICAL
The pictures and link attached shows the procedure of our practical.

VIDEO OF PRACTICAL
The video attached below is a example of how we conducted one of our recordings of the data for the practical.
As you can see there is a weighing scale being used while utilizing the conversion rates of 1mL is 1g.